This article is a summary of what possible analytics and metrics are available in each Social Studio instance alone. It is an introduction to Social Studio Analyze highlighting some elements that have interested me. There are three tools to build up your Analytics in Social Studio:
- Dashboards
- Workbenches
- Reports
What are key elements to have setup prior to using these? Well, add your Social Accounts, set your Topic Profiles, Source Groups, Persona Groups and Author and Post labels. Make sure they are set up and assigned to the correct Workspaces. For those setting out in Social Studio and not used to all the elements as yet, here is a quick definition of the elements mentioned above:
- What is a Workspace?
These are core to your Social Studio setup. They enable a company to establish groups or in essence workspaces so that content and engagement can be organised by social accounts, geography, campaigns or departments / business units. Access to each separate group can be open or locked down to specific users. - What is a Topic Profile?
These are media search tools within Social Studio. These contain unique keywords for a subject of interest to your organisation. This could be your brand or other brands, subjects relevant to you or companies you are interested in. Topic Profiles are key elements in your Social Studio setup. - What is an Author Label?
Author labels can be used to tag an account or feed who post or respond to you to help categorise them. - What is a Post Label?
Post Labels tag a post that you can use to run analytics or automation based on that label. You can create more than one Post Label. For example, “Promotion”. - What are Source Groups?
These assist with fine tuning Topic Profiles and searches. You can use them to exclude competitor conversations, or focus on them. They allow you to provide a focus by matching to multiple sources such as a group of influencers or exclude spam or unwanted content. - What are Persona Groups?
For this, you will need to ensure you have a Salesforce org connected to Social Studio. Providing a contact in Salesforce has an associated Social Persona, Persona Groups will be able to see them. Social Persona is an object in Salesforce which enables you to maintain a contact’s social network profiles. This is part of Social Customer Service configuration in Salesforce. Persona Groups can be created from All Contacts, Contacts with Open Cases or recently closed cases, or New contacts (those created in the last 30 days).
So with those definitions out of the way, let’s run through the tools under Social Studio Analyze.
Dashboards
Dashboards provide an at-a-glance monitoring interface for your brands, social accounts and other social data and competitors. It surfaces for social activity performance of posts, topics, keywords and sentiment trends for time periods from 3 to 93 days. They are workspace and user specific. They can be exported as a pdf.
There are multiple predetermined Dashboard types that you can use to create your Dashboards. If you don’t like the out of the box Dashboard types, there is also the option to create your own from a blank template. Each Dashboard can only focus on either social accounts or a single topic profile.
From the available Dashboard types I am going to highlight Social Listening Summary, Persona Group and Engagement Summary.
- Social Listening Summary Dashboard: This dashboard contains Cards for the Feed, Post Volume, Influencers, Keyword Groups, Media Type Trend, top Words (in a word-ly), Countries, Languages, Sentiment and Sentiment Trend.
On creation you have to choose the topic profile that you wish to listen to. You also choose which media types you want to filter down to, such as twitter only. Following that you set a region by all countries, or selected countries. You can then include or exclude feeds by applying a source group.
- Persona Group Dashboard: You can only have one Persona Group per Perona Group Dashboard, but can have multiple Dashboards focussing on different Persona Groups. For using Persona Group Dashboards – you will need to ensure that your Salesforce org has been connected and you have configured Social Customer Service. As flagged above in the definitions Persona Groups can be created once you have a Salesforce org connected. Note a Persona Group requires at least 100 authors for data to appear. If you are not seeing anything on create – expand the date range or adjust keywords to ensure that you have a wider Persona Group.
- Engagement Summary Dashboard: Select one or more Social Accounts to analyse. YOu will be presented with cards for Response Rate and average Response time, Time distribution, Engagement by Classification, a Leaderboard and Feed.
There are additional Social Account Summary dashboards available for Facebook, LinkedIn, Google+, YouTube, Instagram and Pinterest. Each dashboard can have up to 50 accounts.
When you click on Analyze, you will be taken to the Analyze Gallery. Clicking on a Dashboard takes you to the card display of the factors you have requested Social Studio to “listen” to.
The magic doesn’t finish there. You can also filter the entire Dashboards beyond the initial setup. You can choose to filter by date range, Review ratings, Assignment, Classification, Sentiment and Post and Author Labels (to mention a few).

Additionally, each Dashboard is a collection of cards. The cards cannot be customised but you can view post-level data through Post Inspector. Post Inspector is accessible by clicking on an individual post in the Dashboard. Post Inspector enables you to view and change the information related to the post you are inspecting, view activity relating to the post and apply Engagement Macros.
Under info in Post Inspector, you can set a Status (such as new content, not reviewed, recommend follow-up, referred or commented and closed). You can set a Priority (low, medium, high) or select an assignment. What I like here is that you can also adjust the sentiment and classification for the individual post. Say a post has been automatically flagged as negative. If on reading the post you are of a different opinion you can reset the sentiment to neutral or positive. This helps fine tune your sentiment model.
At the top right of each Card is a drop down arrow. This allows the user to Inspect (dependent on type of card), export as csv (if they have that level of access and the card allows) or use the card to create a Twitter Persona group (for example from a Social Listening Dashboard card). Inspect in this context permits you to look at the card data more granularly.
A nice feature of the Top Words card is that you can click on a Word in the word-ly and the tweets shown in the feed will filter to those containing the word you have clicked on.
Workbenches
Workbenches enable you to analyse your data by combining multiple segmentation types. The datasets that you select to analyse can be based on topic profiles or social accounts. These are created by you from start to finish – no predetermined cards. You can pull in more than one dataset into a Workbench. They can be filtered by:
- Keyword Groups
- Language
- Media Type
- Post and Author Labels
- Region
- Sentiment
Additionally you can alter the time range to analyse again between 3 to 93 days.
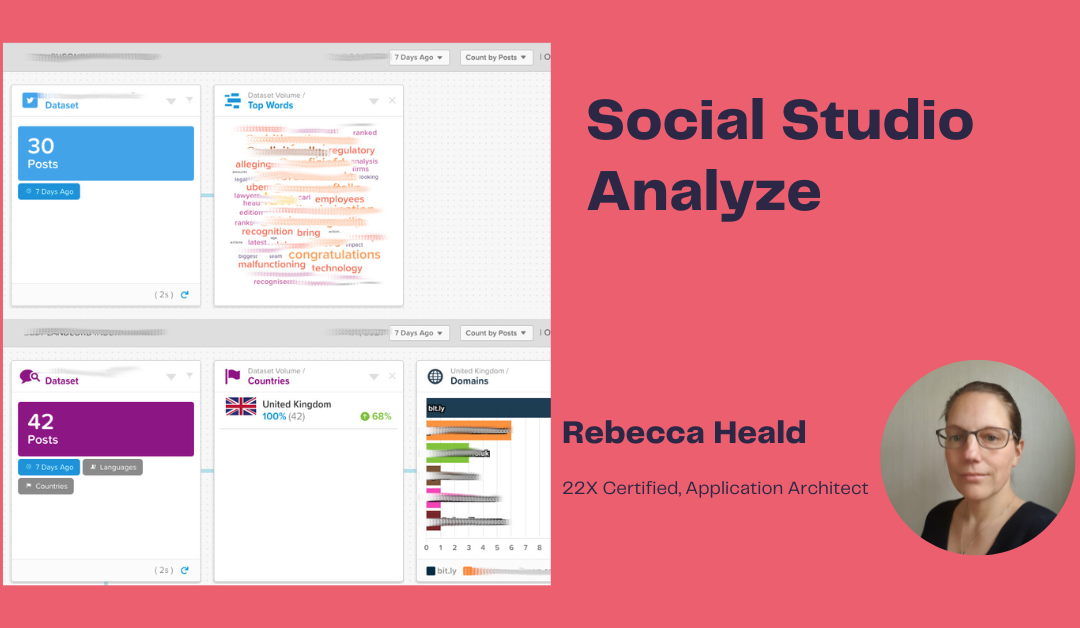
Although each dataset can contain one or more topic profiles or social accounts, they can’t have a mixture of topic profiles and social accounts. You also can’t have different social account datasets in the same dataset. So add as many social accounts as you choose – but do not mix Twitter with LinkedIn or Facebook. They can appear as a separate dataset on the same Workbench but can be compared side by side. Below is a screenshot of a Twitter Account and a Topic profile that are being drilled down in a Workbench.

Once a dataset is added, click on the card (anywhere in white space that you see) and you will get a number of options to drill-down the data with. From A to Z:
Both Social Accounts and Topic Profiles
- Assignment
- Author Labels
- Classification
- Core – the Core Card presents a summary of the data from the topic profile or social account. It is the basis for other cards in the dataset.
- Country
- By Segment (breakdown of Countries and whether engagement has gone up or down)
- By trend (by media type)
- Post Label
- Sentiment
- Status
- Top Words
- Volume Trend
Topic Profiles Only
- Basic Demographics – summary by age, location or gender.
- BiText – A paid for addition to Social Studio that allows a drill down on sentiment analysis and to identify topics on topic profiles.
- Domains – shows the top 50 domains by frequency (within the given time period).
- Einstein Vision
- Hashtags – only applies to a social listening dataset. It shows the top 50 hashtags used in the top profile over the given time period.
- Keyword group and Keywords (up to 15 keywords)
- By Segment
- By Trend
- Share of Voice
- Sources – the top 50 sources within the given time period
- Usernames – shows top 50 twitter handles gathered from a topic profile over the given time period.
Select one of these and a branch of the dataset will appear filtering / viewing the original dataset from that perspective.

Note that these Workbenches are unique to the person who created the Workbench. So cannot be shared.
Reports
So we have seen Dashboards (which can be shared), Workbenches (which cannot be shared) and now Reports. Reports enables us to receive segmented data directly to an inbox or Mobile app. When creating a new report, you specify your dataset, filters (similar to the filters for Dashboards and Workbenches) and date range. There are also options for the Format (PDF or CSV) and to Schedule. These can be scheduled to run on a recurring basis.
When creating reports, you can create:
- Dashboard reports
- Post reports for Social Accounts
- Post reports for Topic Profiles
- Real-Time Post reports (for Topic Profiles only).
Use this to view post reports as they come in. The reports only hold posts that have come in since the last report. Frequency can be from 10 minutes to 3 hours.
In summary, the tools provide interesting ways for the Social Studio Analyst to view, segment and drill-down with data.